Next steps with Tracing 更进一步使用 Tracing 日志
Tokio-console Tokio 控制台
tokio-console是一个类似于 htop 的实用工具,让你可以看到应用程序的 span 和事件的实时视图。它还可以表示 Tokio 运行时创建的“资源”,例如任务。这对于理解开发过程中的性能问题至关重要。
例如,要在mini-redis 项目中使用 Tokio 控制台,你需要在 Tokio 包开启tracingfeature:
# Update the tokio import in your Cargo.toml
tokio = { version = "1", features = ["full", "tracing"] }
注意,full没启用tracing。
你还需要添加console-subscriber包依赖。这个 crate 提供了一个Subscriber实现,可以替换掉 mini-redis 中使用的实现:
# Add this to the dependencies section of your Cargo.toml
console-subscriber = "0.1.5"
最后,在src/bin/server.rs,替换调用tracing_subscriber为console-subscriber:
替换:
#![allow(unused)]
fn main() {
tracing_subscriber::fmt::try_init()?;
}
为:
#![allow(unused)]
fn main() {
console_subscriber::init();
}
这将会启用console_subscriber,这意味着任何与tokio-console相关的追踪都将被记录。日志仍会被输出到 stdout(基于RUST_LOG环境变量的值)。
现在我们应该准备好再次启动 mini-redis,这次使用tokio_unstableflag(这是启用日志追踪的必要操作):
RUSTFLAGS="--cfg tokio_unstable" cargo run --bin mini-redis-server
tokio_unstableflag 让我们可以使用 Tokio 提供的额外 API,这些 API 目前没有保证稳定性(换句话说,这些 API 允许对它进行重大更改)。
cargo install --locked tokio-console
之后运行:
tokio-console
你将会看到的初始时图是正在运行的 tokio 任务。
例如:
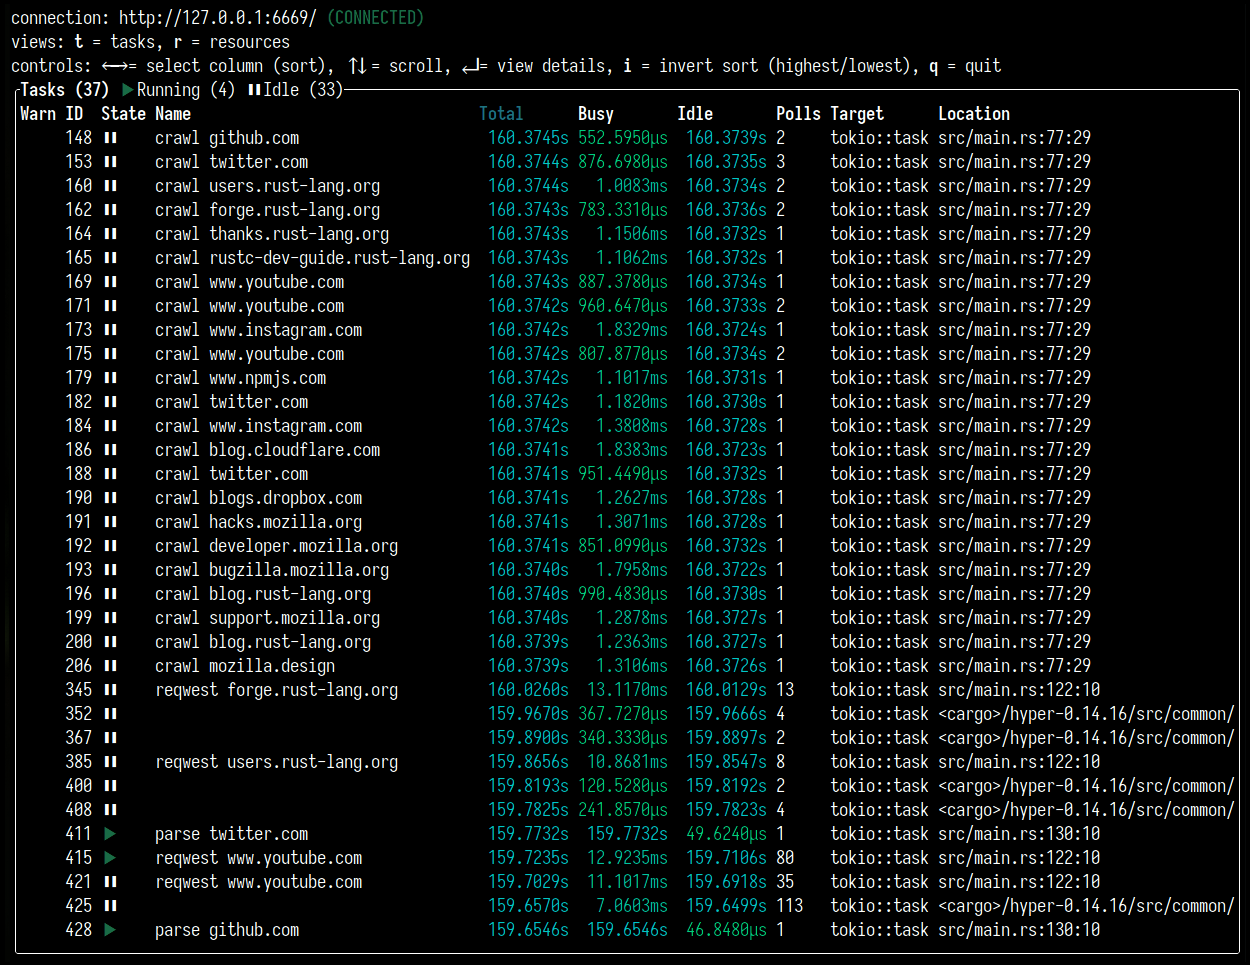
它还可以在任务完成后展示一段时间(这些任务将被显示为灰色)。您可以通过运行 mini-redis hello world 示例(这在mini-redis 存储库中可以找到):
cargo run --example hello_world
如果你按下r,你会进入资源视图。这展示了信号量,锁,和其他属于 TOkio 运行时的结构。例如:
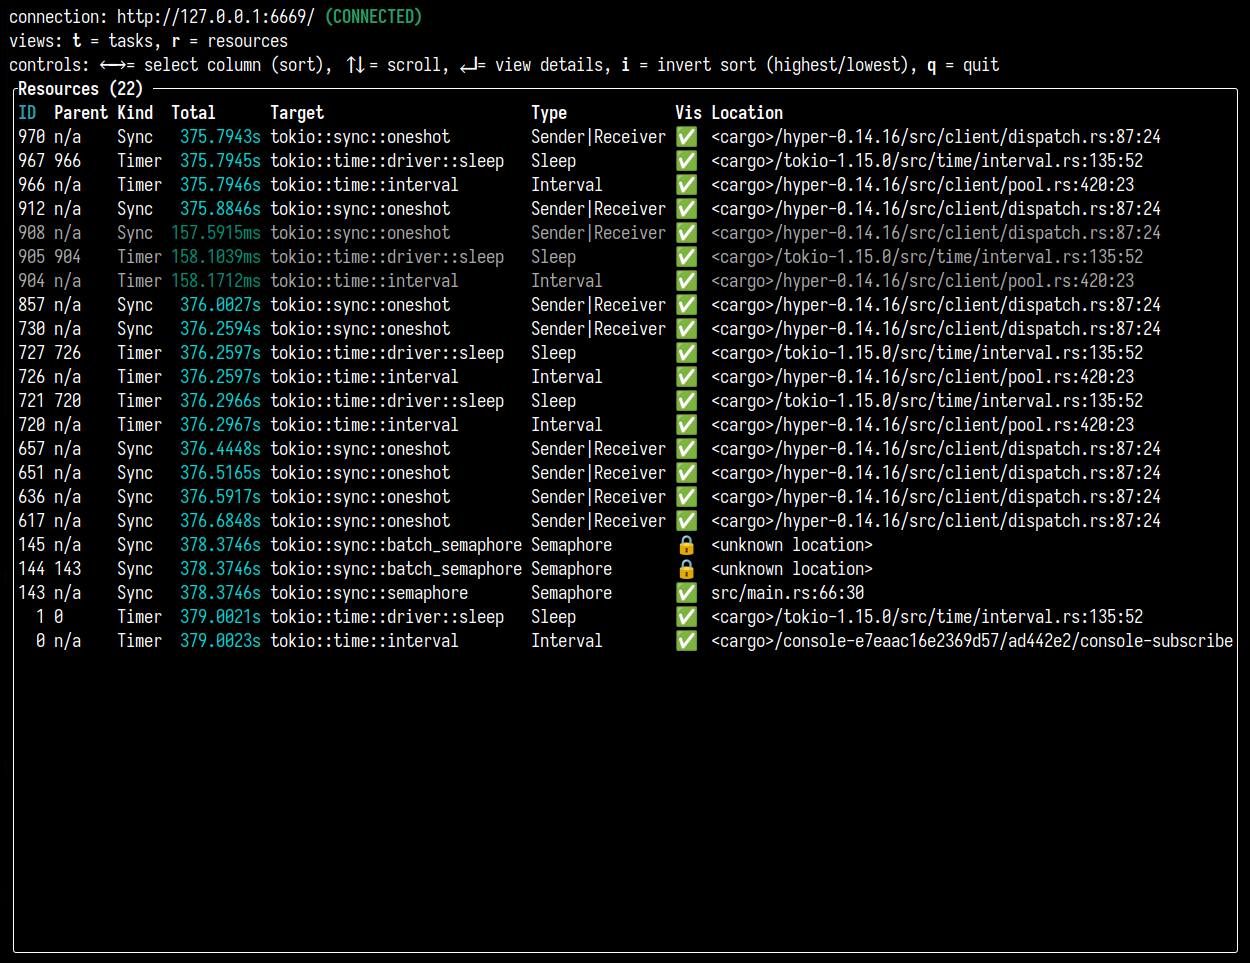
每当你需要查看 Tokio 运行时内部来更好地理解你的应用程序性能时,你可以使用 tokio-console 来查看正在发生什么,帮助你发现死锁和其他的状况。
了解更多如何使用 tokio-console,请查看文档页面。
与 OpenTelemetry 集成
OpenTelemetry (OTel)有多种含义;首先,这是一个开放规范,定义满足大多数用户的日志跟踪和指标的数据类型。这也是一系列特定语言的 SDK,提供检测,便于从应用中发出日志跟踪和指标。第三点,还有 OpenTelemetry Collector,一个与你的应用一起运行的二进制文件,用于收集日志跟踪和指标,最后将其推送给 telemetry vendor(遥测供应商),比如 DataDog,Honeycomb 或者 AWS X-Ray,它也可以将数据发送到 Prometheus 等工具。
Opentelemetry crate提供了 Rust 的 OpenTelemetry SDK,也就是我们本教程中使用的。
本教程中,我们将设置 mini-redis 将数据发送到Jaeger,这是一个用于可视化追踪的 UI。‘
这是一个 Jaeger 的运行实例,你可以使用 Docker:
docker run -d -p6831:6831/udp -p6832:6832/udp -p16686:16686 -p14268:14268 jaegertracing/all-in-one:latest
你可以通过http://localhost:16686来访问 Jaeger 页面。它启动后长这样:
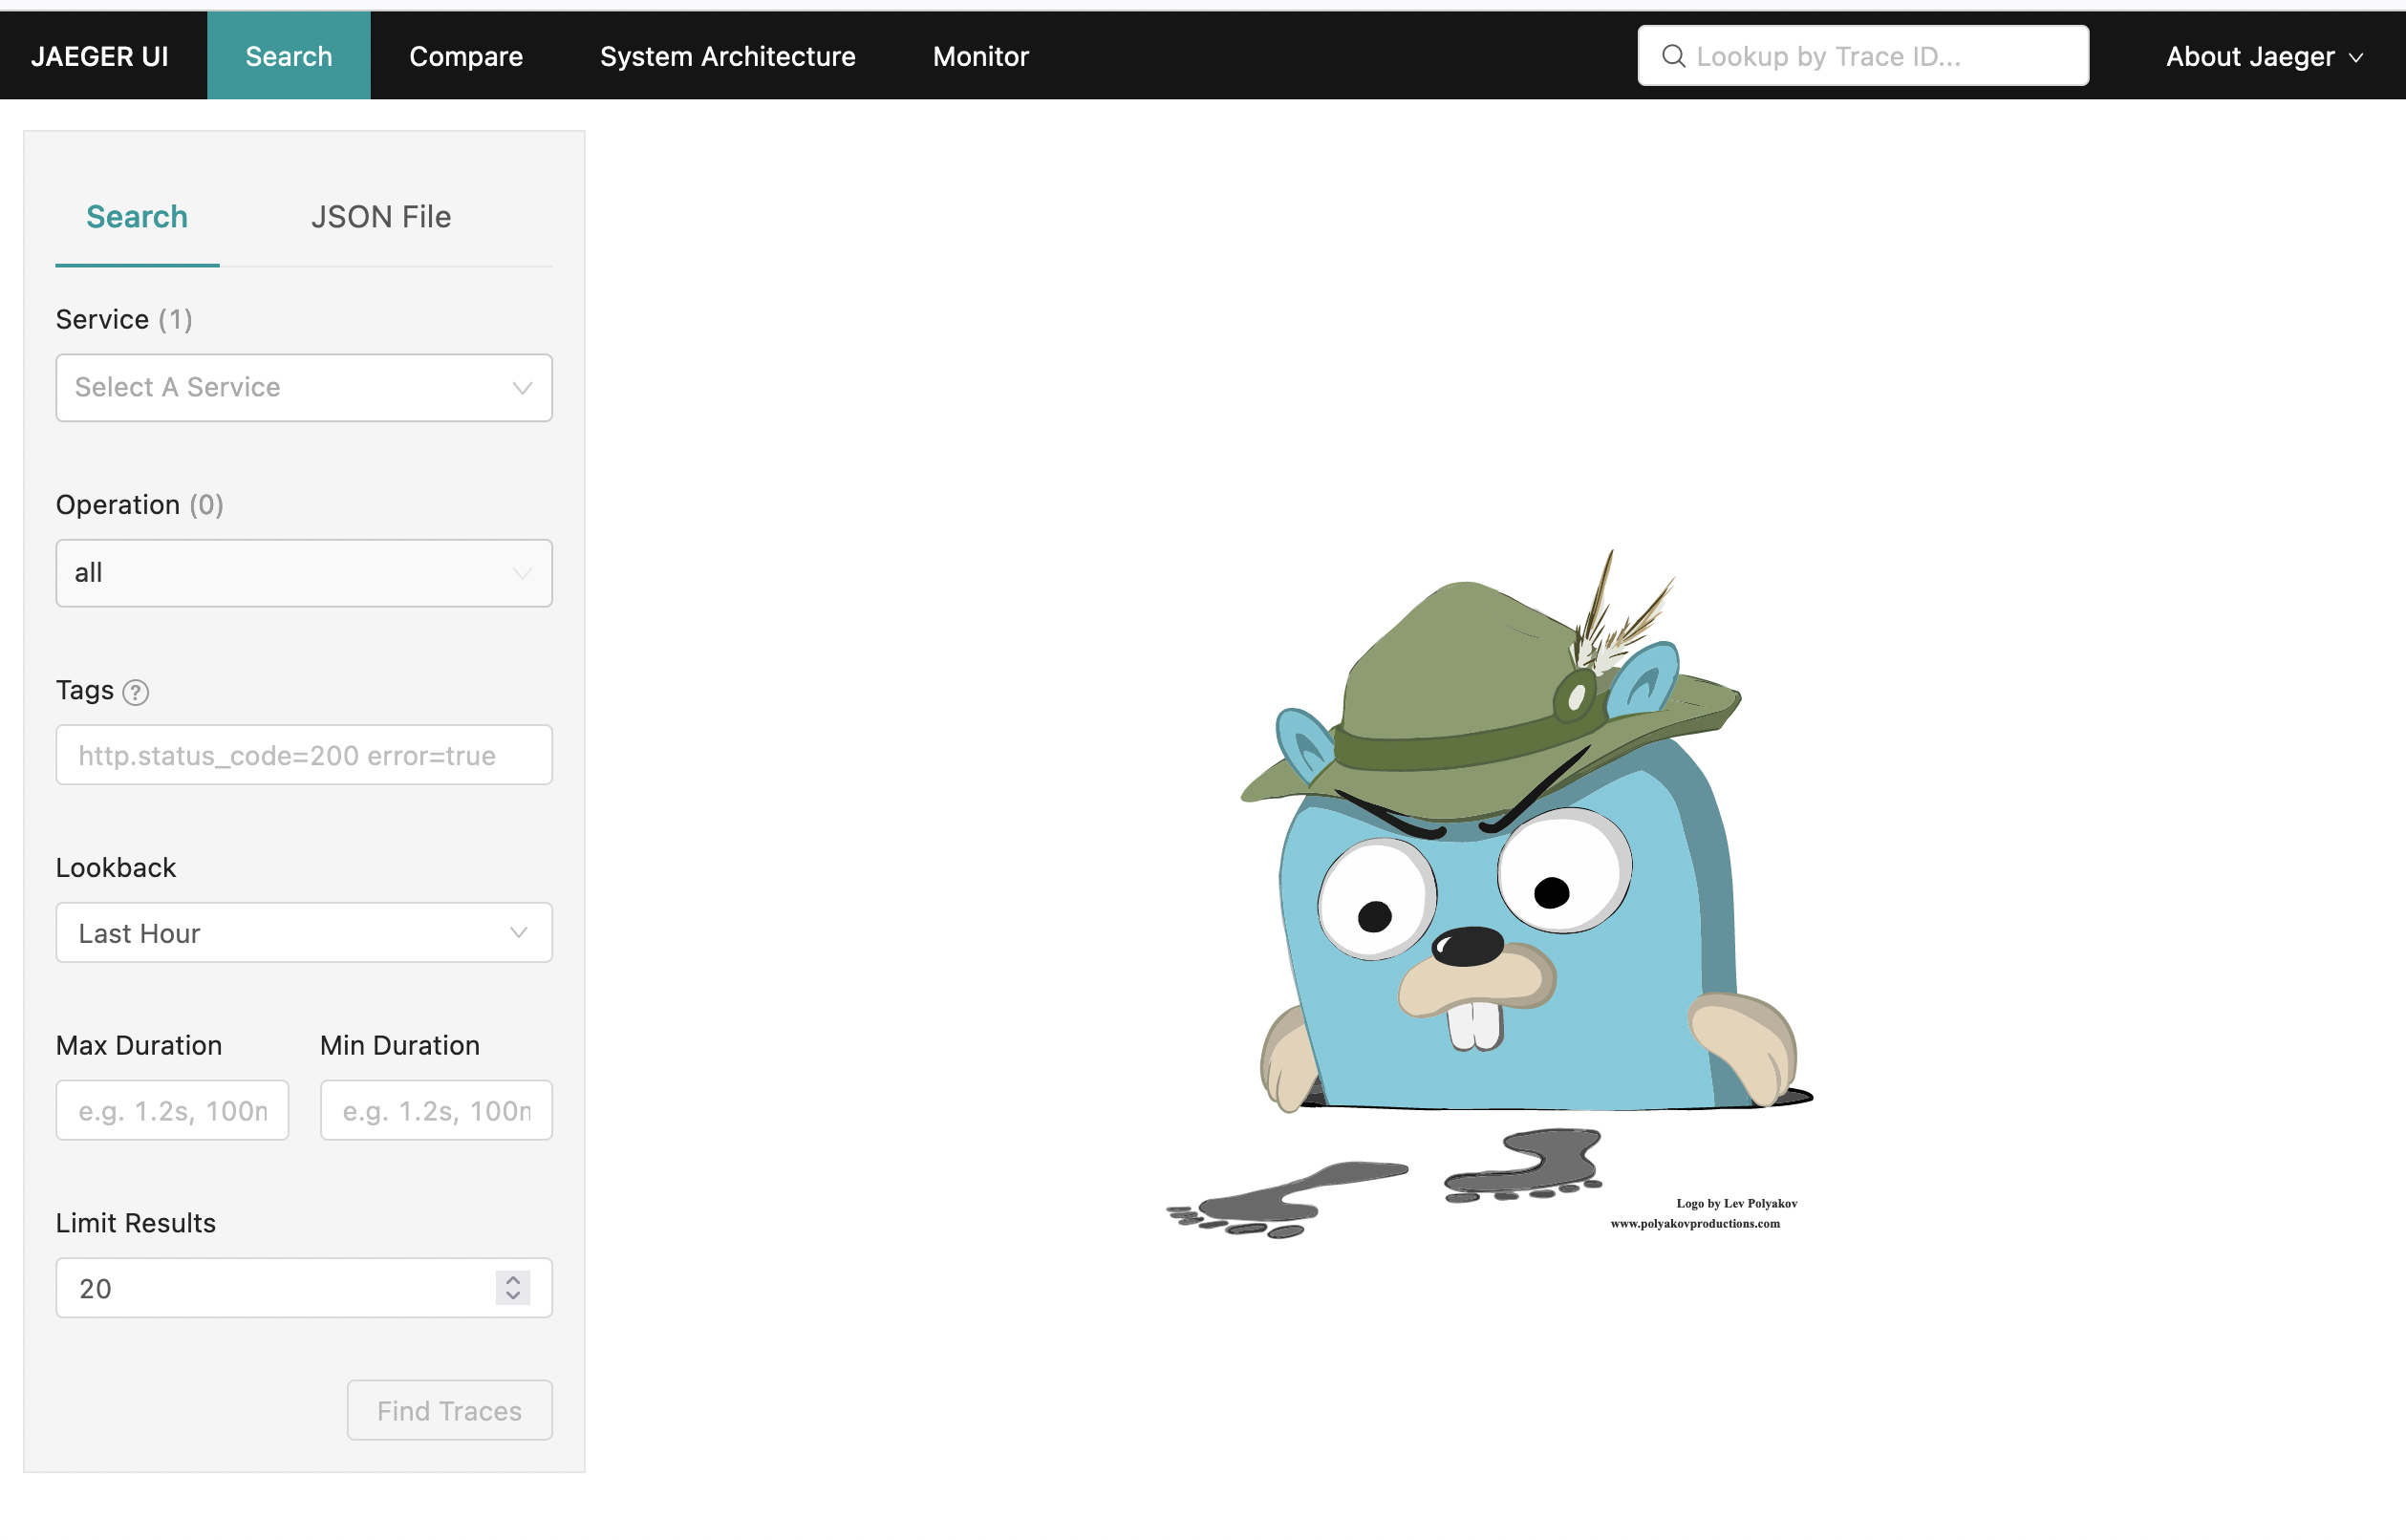
生成并发送一些跟踪数据后,我们将返回此页面。
要设置 mini-redis,我们首先需要添加一些依赖项。使用以下内容更新你的 Cargo.toml:
# Implements the types defined in the Otel spec
opentelemetry = "0.17.0"
# Integration between the tracing crate and the opentelemetry crate
tracing-opentelemetry = "0.17.2"
# Allows you to export data to Jaeger
opentelemetry-jaeger = "0.16.0"
现在,在src/bin/server.rs中添加以下导入:
#![allow(unused)]
fn main() {
use opentelemetry::global;
use tracing_subscriber::{
    fmt, layer::SubscriberExt, util::SubscriberInitExt,
};
}
我们稍后来看它们各自的作用。
接下来使用 OTel 替换tracing_subscriber。
替换:
#![allow(unused)]
fn main() {
tracing_subscriber::fmt::try_init()?;
}
为:
#![allow(unused)]
fn main() {
// Allows you to pass along context (i.e., trace IDs) across services
global::set_text_map_propagator(opentelemetry_jaeger::Propagator::new());
// Sets up the machinery needed to export data to Jaeger
// There are other OTel crates that provide pipelines for the vendors
// mentioned earlier.
let tracer = opentelemetry_jaeger::new_pipeline()
    .with_service_name("mini-redis")
    .install_simple()?;

// Create a tracing layer with the configured tracer
let opentelemetry = tracing_opentelemetry::layer().with_tracer(tracer);

// The SubscriberExt and SubscriberInitExt traits are needed to extend the
// Registry to accept `opentelemetry (the OpenTelemetryLayer type).
tracing_subscriber::registry()
    .with(opentelemetry)
    // Continue logging to stdout
    .with(fmt::Layer::default())
    .try_init()?;
}
现在你可以启动 mini-redis:
cargo run --bin mini-redis-server
在另外一个终端,运行 hello world 例子(这在mini-redis 存储库中可以找到):
cargo run --example hello_world
现在,刷新打开的 Jaeger UI,然后在主搜索页面上,找到“mini-redis”服务下拉列表的选项/
选择该选项,点击“Find Traces”按钮。将会展示我们通过运行示例发出的请求。
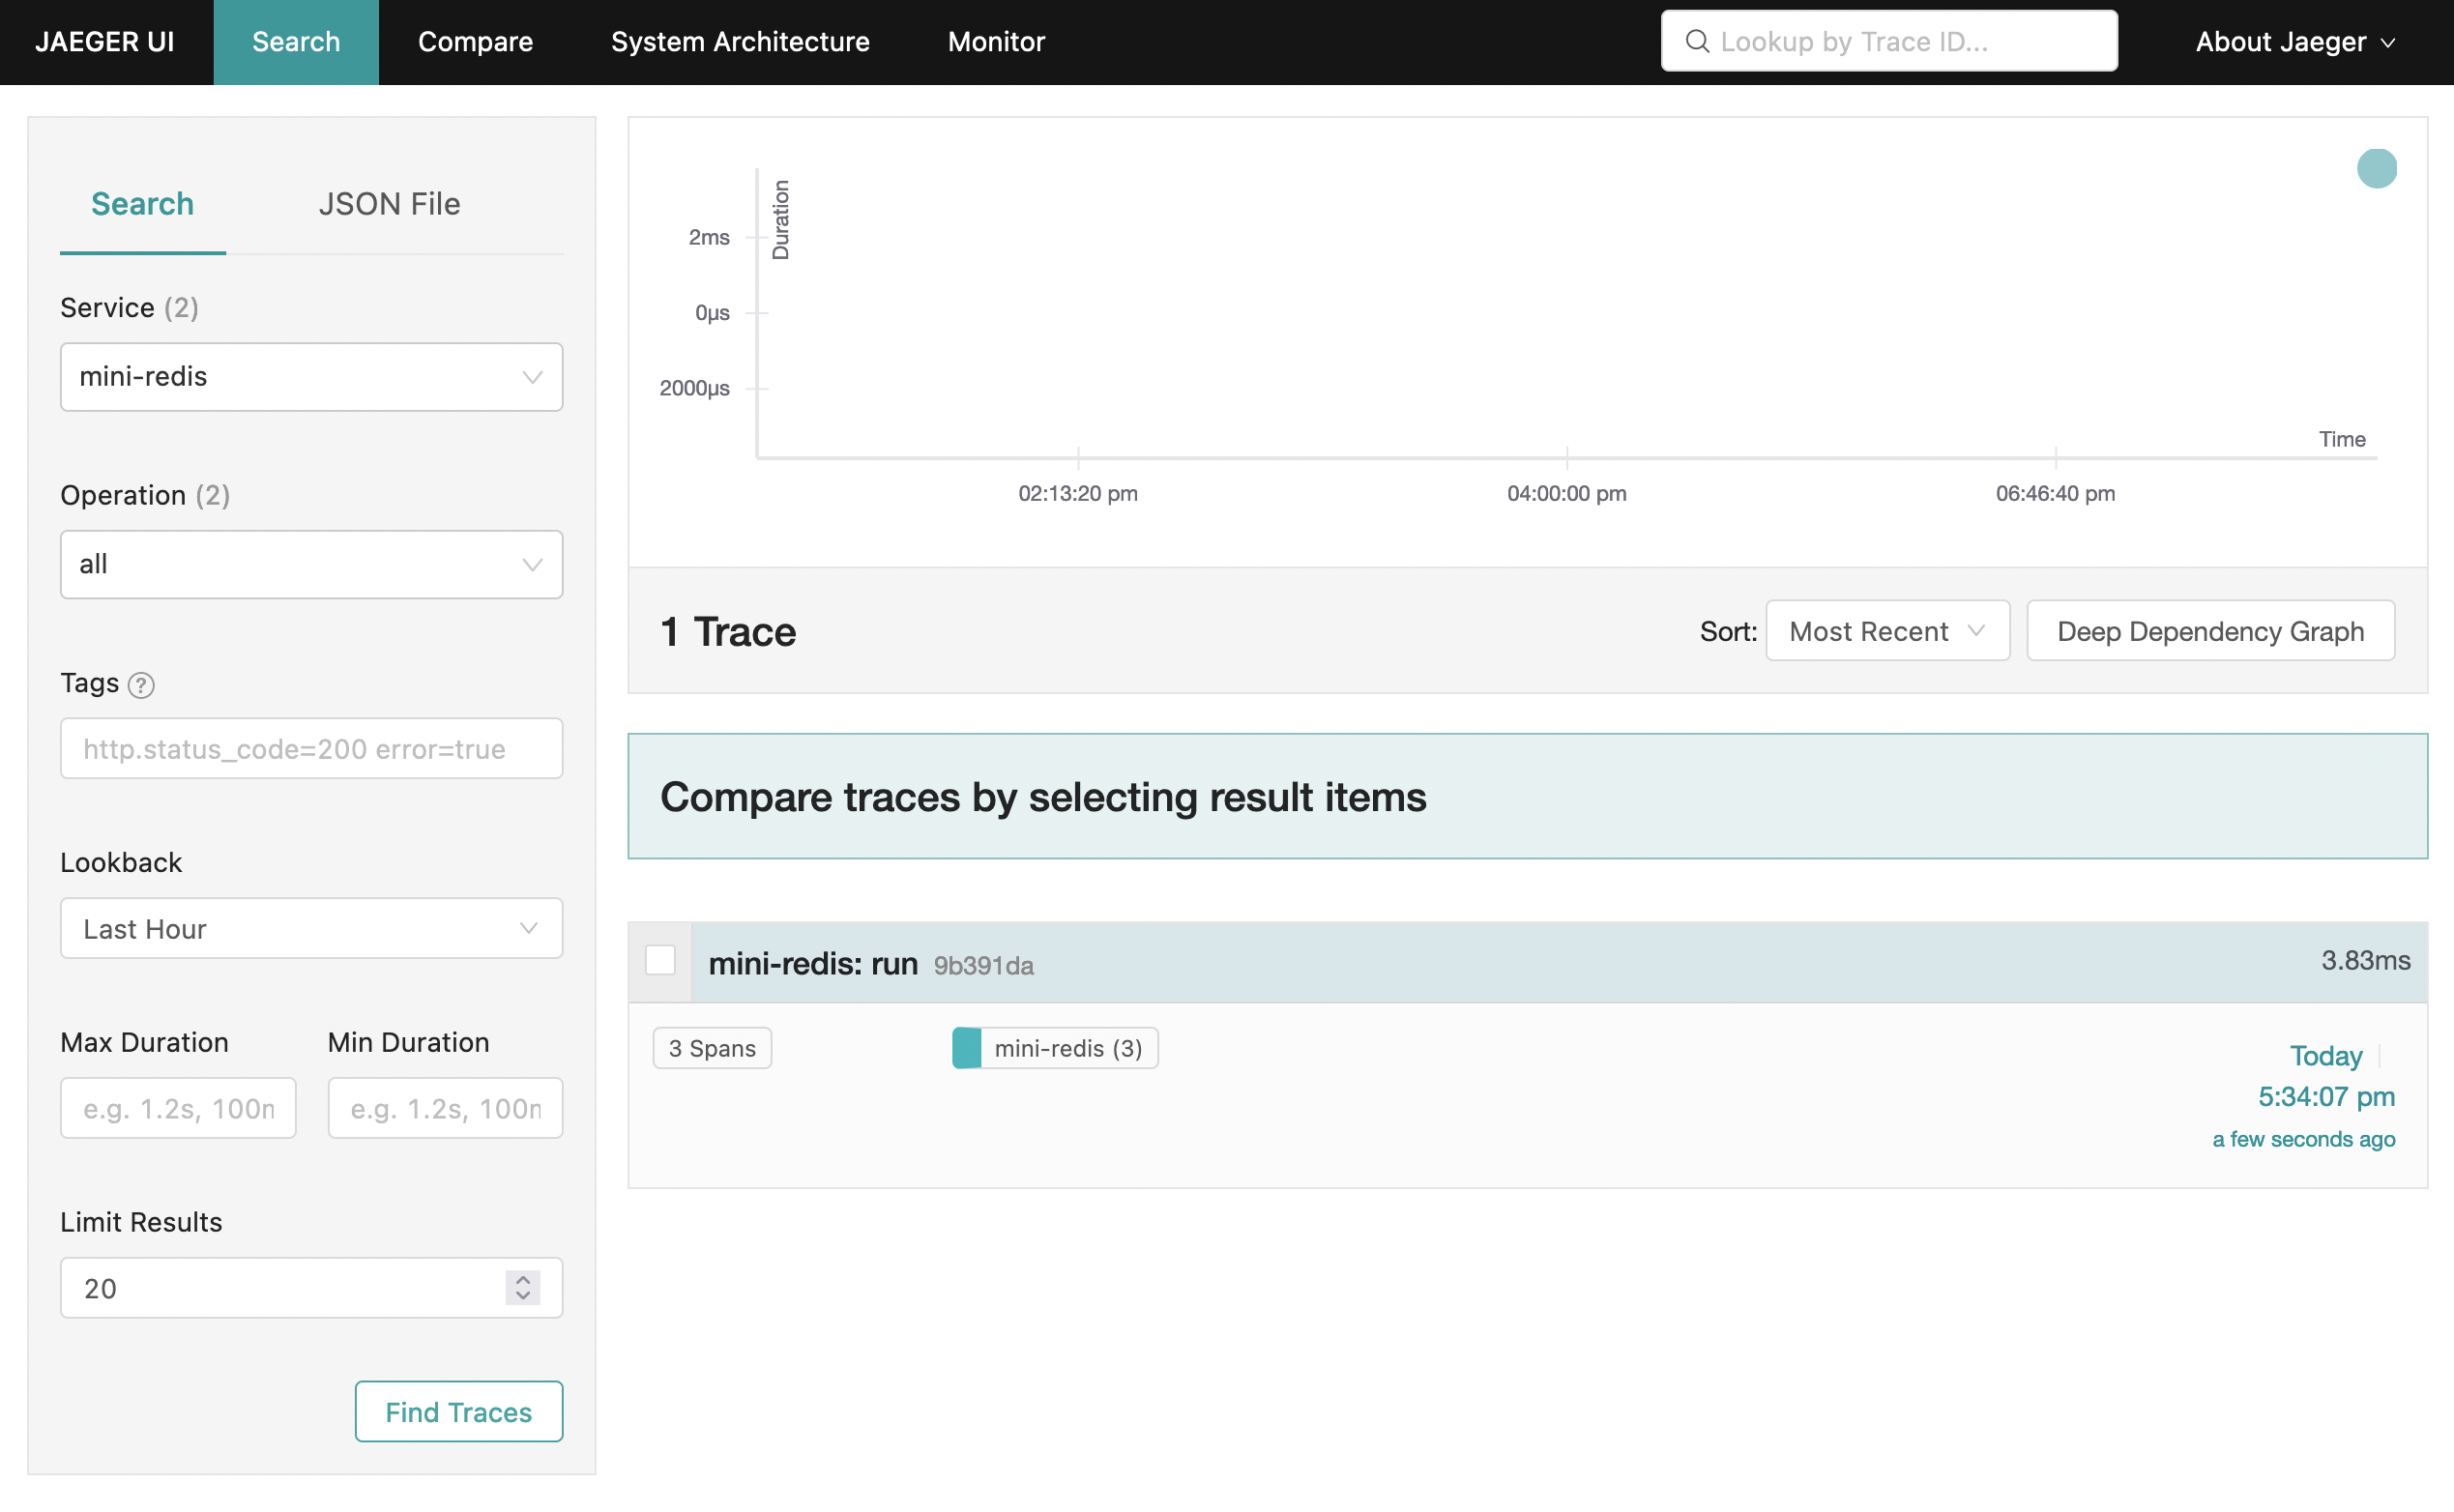
单击跟踪会显示在处理 hello world 示例期间发出的 span 的详细视图。
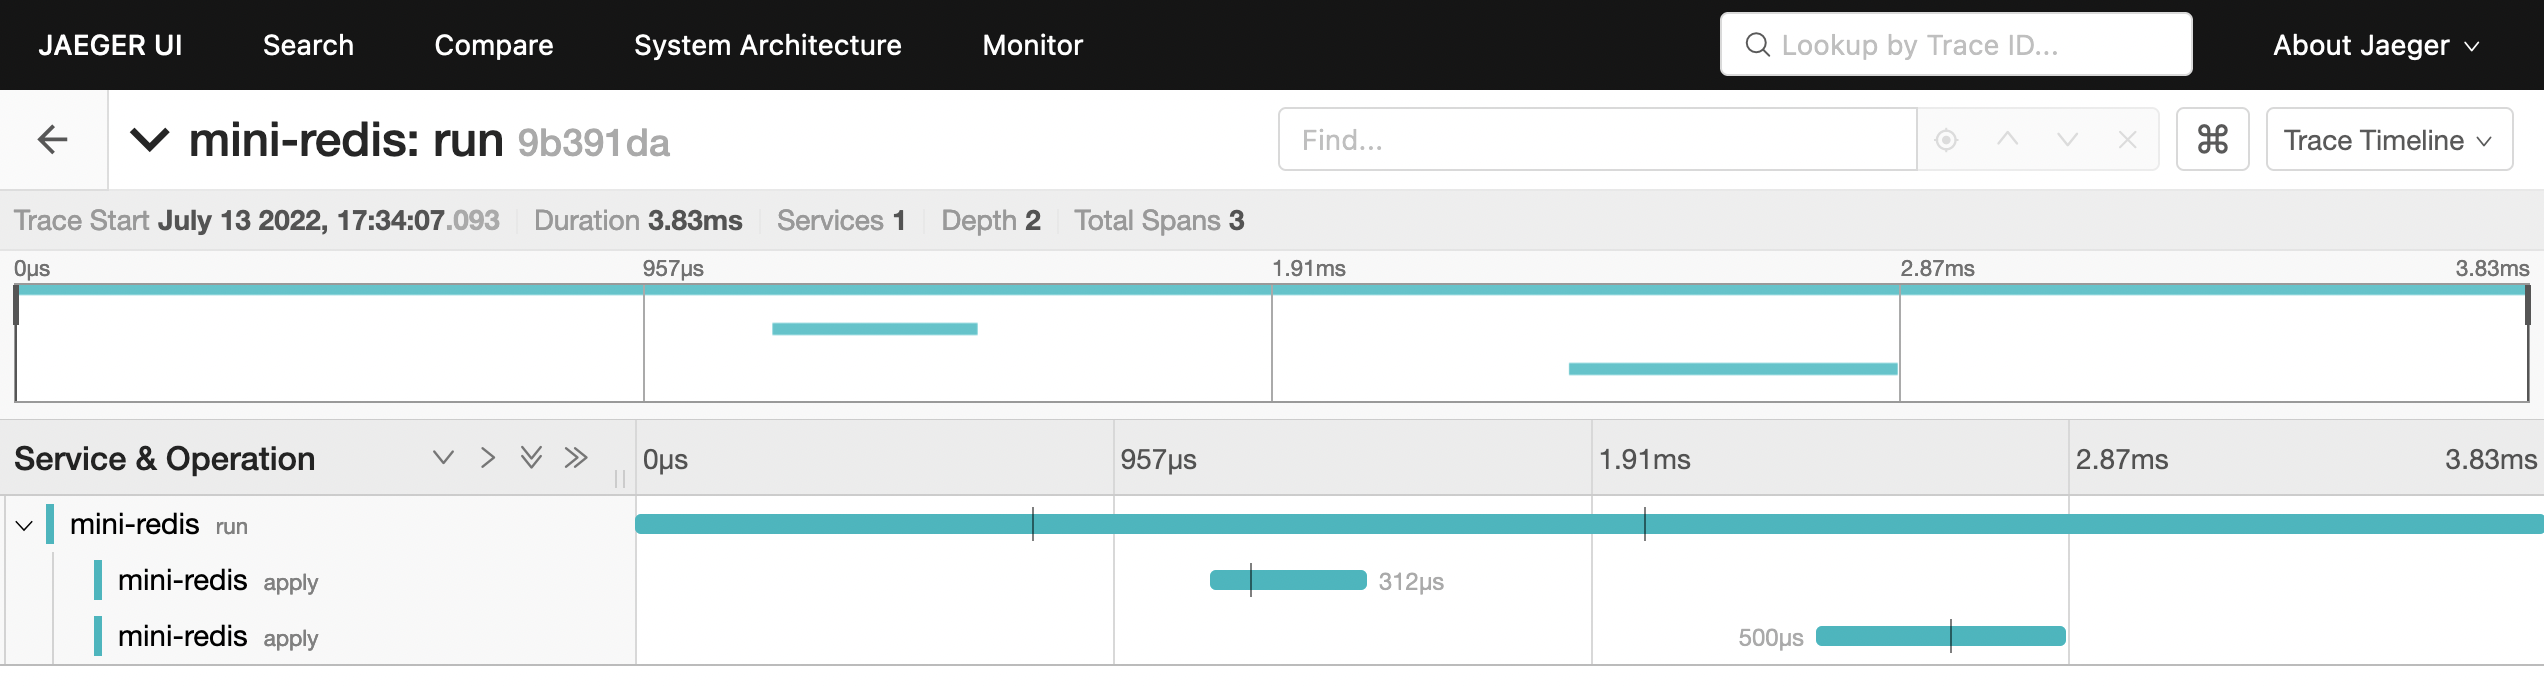
就是这样!你可以通过发送更多请求,为 mini-redis 添加额外的工具或遥测供应商(而不是我们在本地运行的 Jaeger 实例)设置 OTel 来进一步探索,对于最后一个,你可能需要引入一个额外的 crate(例如,为了把数据发送到 OTel Collector,你需要opentelemetry-tolp crate)。在opentelemetry-rust 存储库中有很多可用的实例。
注意 mini-redis 仓库已经包含了使用 AWS X-Ray 的 OpenTelemetry 的完整实例,详细信息可以在README,以及Cargo.toml和src/bin/server.rs文件中找到。